
Educate Yourself About Nutrition: How to Read Nutrition Labels
Reading Time: 6 Minutes
As we all breathe a sigh of relief that 2020 is winding down, we can start to look forward to a new year full of new opportunities.
I know I certainly am!
Though things may not (or may never) be “back to normal” as we may like - we can still look forward to what positive things a new year can bring. And it is within your power to choose where you go from here
Moving forward, you can choose to become more knowledgeable about how various foods affect your body and brain, or you can continue doing what you have always done and remain where you have always been.
The choice is yours.
If you are ready to start educating yourself about how nutrition can help or hinder your health and wellbeing, then join me this coming year, and you won’t be disappointed! Be sure to subscribe to my YouTube channel, join me on all the major podcast platforms, and follow me on Instagram. There will be many changes happening on the HappiHuman front in 2021 and we’d love to have you join us for the ride!
To help you get started, this week we’d like to educate you about Canada’s Nutrition Facts tables.
Of course, the absolute best, healthiest foods are those that do not require labels. Translation: foods that do not need a nutritional label are whole real foods found in their natural state or as close to it as possible.
Realistically, however, in this day and age not everyone is making all meals at home from scratch. That’s why we decided to help you make the best decisions possible when choosing foods from a package. The following information is based solely on Canada’s nutrition facts tables and does not take actual ingredients into account. If you would like a guide for the best (and worst) ingredients to look for (or avoid) in a product, please let us know in the comments section below.

Available on iTunes, Spotify & all major platforms
Nutritional Facts Tables
The Nutrition Facts table is on the side of most packaged foods. It’s often found close to the ingredient list.
The purpose of it is to help consumers make better nutritional decisions. When people can see the number of calories, carbohydrates, sodium, etc., in food, they should be able to eat better, right?
Whether you like the Nutrition Facts table or not, let’s make sure you get the most out of it since it’s plastered on all the packaged food we eat - and, it’s here to stay!

Here’s our four-step crash course on reading the Nutrition Facts table.
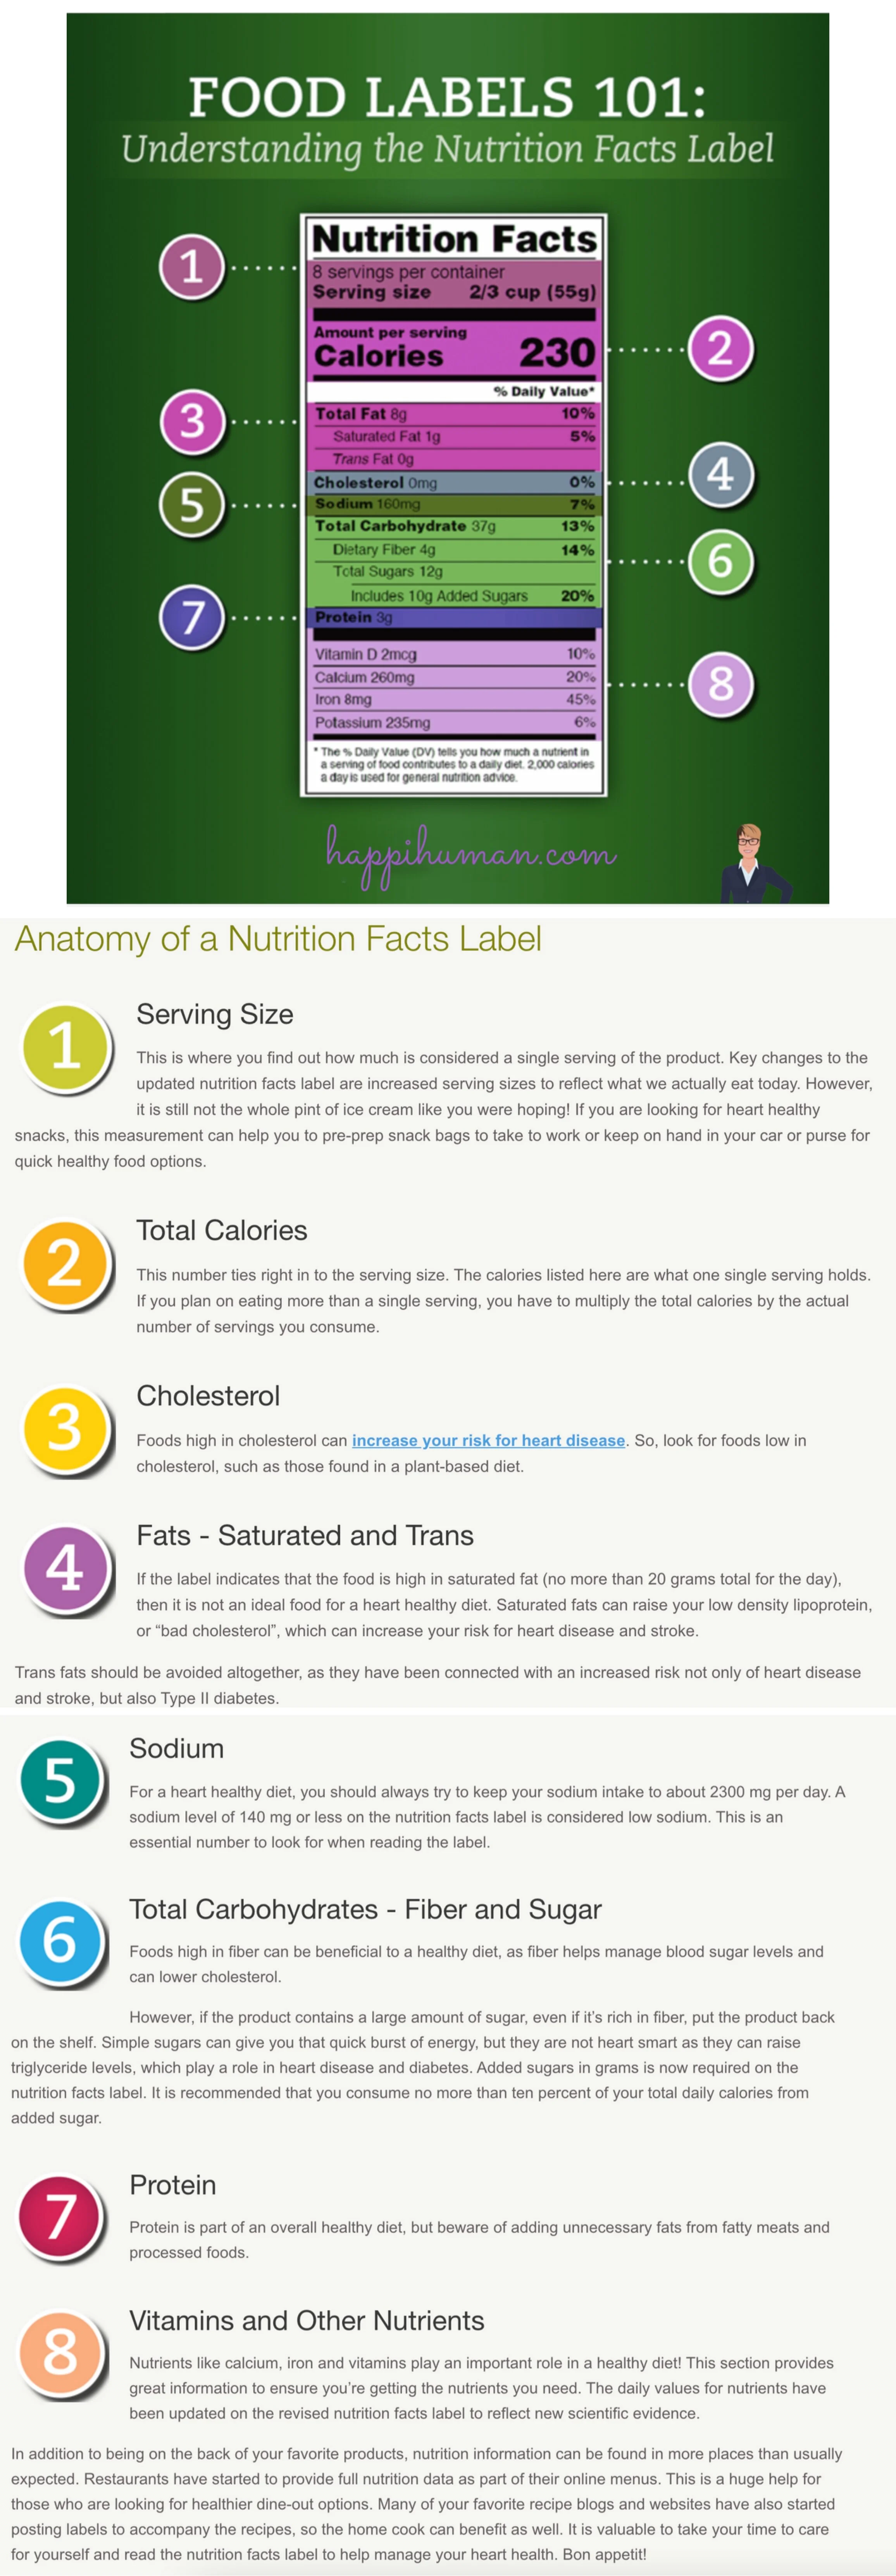
Step 1: Serving Size
The absolute most important part of the Nutrition Facts table is to note the serving size. Manufacturers often strategically choose the serving size to make the rest of the table look good. Small serving = small calories/fat/carbs. So, it gets tricky.
When we buy a package of anything, from a bar of chocolate to a jar of kombucha, we may consume the entire product in one sitting. We may even look at the calories and amount of fat or protein. But what we may not consider is how many servings are contained in that package. Take a bottle of kombucha, for example. Most bottles contain 2 servings, yet many people drink the whole bottle in one sitting. That means we have consumed twice the calories and double the amount of sugar displayed on the table.
All the information in the table rests on the amount chosen as the serving size. And, since every manufacturer chooses its own, a serving size becomes arbitrary, making it difficult to compare two products.
In Canada, over the next few years (from now until 2022), serving sizes will be more consistent between similar foods. This will make it easier to compare foods. The new labels will also have more realistic serving sizes to reflect the amount that people eat in one sitting, and not be artificially small. [1]
Let’s use an example - plain, unsalted walnuts from Costco.
As you can see, right under the Nutrition Facts header is the serving size. In this case, that is a ¼ cup or 30 g. This means that all the numbers underneath are based on this amount.
FUN EXPERIMENT: Try using a measuring cup to see exactly how much of a certain food equals one serving. You may be surprised at how small it is - imagine a ¼ cup of walnuts. A ¼ cup may contain only a few walnuts (for 200 calories), yet we could easily eat more than that without even thinking.


Step 2: Percent Daily Value
The Percent Daily Value (%DV) is based on the recommended daily amount of each nutrient the average adult needs. Ideally, you will get 100% DV for each nutrient every day. This is added up based on all of the foods and drinks you have throughout the day.
NOTE: Since children are smaller and have different nutritional needs if a type of food is intended solely for children under the age of 4, then those foods use a child’s average nutrition needs for the %DV.
The %DV is a guideline, not a rigid rule.
You don’t need to add all of your %DV up for everything you eat all day. Instead, think of anything 5% or less to be a little; and anything 15% or more to be a lot. [2]
NOTE: Not every nutrient has a %DV. You can see it's missing things like cholesterol, sugar, and protein. This is because there isn't an agreed "official" %DV for that nutrient. The good news is that the new Nutrition Facts tables will include a %DV for sugar. Keep your eyes out for that.
Step 3: Calories, fat, cholesterol, sodium, potassium, carbohydrates, and protein
The middle of the table comes next. It contains the number of calories and the amount of major nutrients per serving, including fat, cholesterol, sodium, potassium, carbohydrates, and protein.
Calories are pretty straight forward. Using our walnut example from above, a ¼ cup (30 g) of walnuts contains 200 calories.
Fat is in bold for a reason. That 19 g of fat (29% DV) is total fat. That includes the items not in bold underneath it. Here, 19 g of total fat includes 1.5 g saturated fat, 17.5 g unsaturated fat (19 g total fat - 1.5 g saturated fat = 17.5 g unsaturated fat… unsaturated fats including mono- and poly-unsaturated are not on the label, so you need to do a quick subtraction), and 0 g trans fat.
Cholesterol, sodium, and potassium are all measured in milligrams (mg). Ideally, aim for around 100% of potassium and sodium each day. It's easy to overdo sodium, especially if you grab pre-packaged processed foods, fast food, or factory-made snacks. Keep an eye on this number if sodium can be a problem for you (e.g. if your doctor mentioned it, if you have high blood pressure or if you have kidney problems).
Carbohydrates, like fat, is in bold because it is total carbohydrates. It includes the items not in bold underneath it like fibre, sugar, and starch (not shown). Here, 30 g of walnuts contain 3 g of carbohydrates; that 3 g is all fibre. There is no sugar or starch. And as you can see, 3 g of fibre is 12% of your daily recommended value for fibre.
Proteins, like calories, are pretty straight forward as well. Here, a ¼ cup (30 g) of walnuts contains 5 g of protein.

Step 4: Vitamins & minerals
The vitamins and minerals listed at the bottom of the table are also pretty straightforward. The new labels will also list potassium, calcium, and iron. Yes, potassium will drop from the middle of the table to the bottom, and the content of both vitamins A & C will become optional.
Manufacturers will also be able to add other vitamins and minerals to the bottom of their Nutrition Facts table, as well - which will be completely up to their discretion.
As you start to get better at reading the Nutrition Facts tables of the food products you buy (or don’t!), you'll likely notice that some foods contain a lot more vitamins and minerals than others. Based on your unique nutritional needs, this can help you decide if a product is right for you or not. So start taking a moment or two when shopping to look at these nutrition labels - the numbers staring back at you may just be surprising!
Right Click To Download
Conclusion
I hope this crash course in the Nutrition Facts table was helpful. While you can take it or leave it when it comes to making food decisions, it’s here to stay. And it will likely change slightly over the next few years.
Do you still have questions about it? Have you seen the new labels with a %DV for sugar? If so, leave me a comment below.
As always, I welcome your thoughts and value your feedback. Let me know what you think by dropping me a line or commenting below.
If you haven’t already done so, please sign up to receive my newsletters for more information about brain health, neuronutrition, lifestyle tips, and nutritional advice. Of course, if I can help you or a loved one with your nutritional needs, make an appointment to see me today!

[REFERENCES]
https://www.canada.ca/en/health-canada/services/food-labelling-changes.html
https://www.canada.ca/en/health-canada/services/understanding-food-labels/percent-daily-value.html
[Medical Disclaimer]
All information contained in this document is for informational purposes only. It is not intended to diagnose, treat, cure, or prevent health problems. For all serious health issues, please contact a medical or nutrition practitioner. The information provided is based on the best knowledge of the author at the time of writing, and we do not assume liability for the information, be it direct or indirect, consequential, special exemplary, or other damages. In all circumstances, it is always wise to consult your physician before changing your diet, taking supplements, or starting any exercise or health program.